dilluns, 10 d’abril del 2017

Climbing the peak

Climbing the peak


Scenario

In your usual sizing efforts you need to know the peak usage% for a certain workload and server(s). What is the right averaging time to capture this peak? Let’s see possible choices.

Too long averaging time


Averaging Time = 500 min. Peak usage% = 50%.
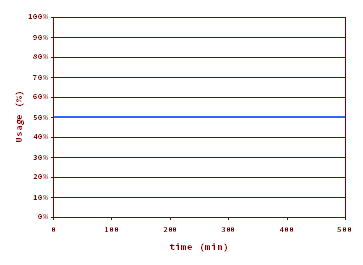
Total loss of finer details. Does this really mean that the usage% has been the same for the 500 min? You, like me, don’t believe that!

Too short averaging time


Averaging Time =  10 s. Peak usage% = 100%.

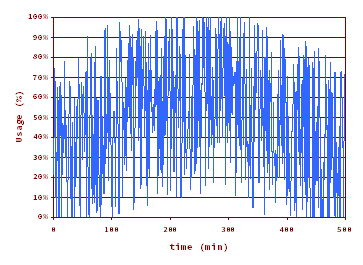
Too much detail. This may be good for performance analysis, but it is confusing for sizing. Spikes goes up to usage%=100%, meaning that for 10 s -the averaging time-  in a row the server is 100% busy. But I wouldn’t consider that the server usage% is 100% for sizing purposes. If you do so you most probably are oversizing, a common (and safe) strategy by the way.

The right averaging time?


Averaging Time =  10 min. Peak usage% = 68%.

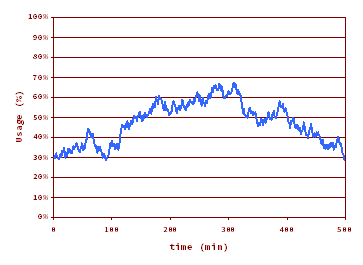
Eureka! This is the right amount of detail. In my point of view the right averaging time for OLTP lies somewhere between 10 min and 1 hour, depending on the workload, on the available data, and on the degree of tolerance to a high usage%.

dilluns, 3 d’abril del 2017

The Degraded Operations Pitfall

The Degraded Operations Pitfall


Let's consider an information system supporting a highly critical online activity. Critical means it cannot fail, and if it fails there must be a contingency infrastructure that allows operations to continue "reasonably" well, with zero or tolerable performance impact.

Someone trying to reduce acquisition cost decides having half of the processing capacity in the contingency infrastructure. Should you, as an expert sizer, feel comfortable with this decision or you shouldn't?
To illustrate the problem let us consider that the workload is the SAP SD benchmark (see "Phases of the SAP Benchmark" entry in this blog). The simplified response time curve is in Figure 1, and it can be seen that the system supports 80000 users with a response time of 1 s.
Figure 1: The response time versus the number of users graph for the normal mode server (blue).

If we put this workload in the 50% capacity degraded model infrastructure, that is: the same population,  the same activity, but with 50% less capacity, what happens?  Look closely at the figure 2.

Figure 2: The response time graph for the normal mode server (blue) and for the contingency one (red) with 50% performance capacity.

With a 50% capacity the response time for 80000 users (1 s in the normal mode server) would be around 12 s! Would anyone consider this is an usable system?

How to successfully solve the above situation? Two lines of action are possible:
  • At the workload side: reduce the number of users, that is, propose a significant restriction in the number of users that can use the system in degraded mode.
  • At the capacity side: increase capacity in contingence, that is, increase the capacity  of the contingency server ideally to 100% of the normal mode.

Summarizing: when sizing degraded mode infrastructures you have to pay much attention to the response time, and not only to the bandwidth (maximum throughput),