Introducing the Response Time
The response time is the loser in the set of all performance metrics. It's systematically ignored in almost every sizing, it’s neither measured nor accounted in most cases, and it's only marginally referenced in certain benchmark definitions. Clearly, the throughput is the winner: SAPS, IOPS, transactions per second are throughput metrics, not response time ones.
But from the end user point of view the response time is the king. Any service center performs very well or very poorly according to the response time perceived by its users. When the response time is bad It doesn't matter to the customers if the system administrator proclaims they are working with a many-oooops-per-second system. Just the system is slow and, consequently, bad. Period.
The Service Center
Look at the following picture, an idealization of any service center. A service center is a place, logical or physical, where customers or users enter, are given a certain service by a worker (or a server), and exit. There's a line (queue) where arriving customers can queue and wait if all the workers are busy.

Figure: Service center with server(s), queue, and arriving and departing customers.
You interact with service centers everywhere, as it is very general concept. For example:
Service Center
|
Service Given
|
Customer
|
Worker
|
Hairdresser’s
|
A haircut
|
People needing a haircut
|
Hairdresser
|
Our Company department
|
A step in an opportunity forward path
|
Company customers
|
Yourself
|
OLTP IT Server
|
CPU time
|
Users entering transactions at their terminals
|
CPU cores
|
Supermarket checkout
|
The checkout payment
|
Supermarket customers
|
Cashier
|
Bus Transport
|
A transport from place A to place B
|
Passengers
|
The driver and the bus
|
Public office desk
|
A request to the public administration.
|
Citizens
|
Public servant
|
Machine Repair Center
|
Fixing the malfunctioning machine
|
Machines
|
Repairman
|
A service center is fully characterized by the following magnitudes:
- The service time (S): the elapsed time a service takes,
- The number of servers (m): the number of customers that can receive service simultaneously.
The Response Time
The Response Time (R) is the time elapsed from the arrival of a customer to the service center to its departure after receiving service.
|
The response time has two contributions: the service time (S) and the wait time (W), resulting in this fundamental relationship:
R = W + S
|
To illustrate this look at the following scenario where we have depicted the flow of several customers through a very simple service center (m=1, S=cte)

- Customer #1 arrives a t=0, finds the worker/server idle, spends no time at all at waiting, is given a certain service taking S units of time, and exits the center of service at t=S. The wait time is 0. The response time is S.
- Customer #2 arrives a t=S, spends no time at all waiting, is given a certain service taking S units of time, and exits the center of service at t=2S. The wait time is 0. The response time is S.
- Customer #3 arrives a t=2S, spends no time at all waiting, is given a certain service taking S units of time, and exits the center of service at t=3S. The wait time is 0. The response time is S.
In this scenario none of its customers must wait for service, and so the response time is equal to the service time. The wait time contribution is zero.
Now look at the following scenario differing from the previous one in the way customers arrive.
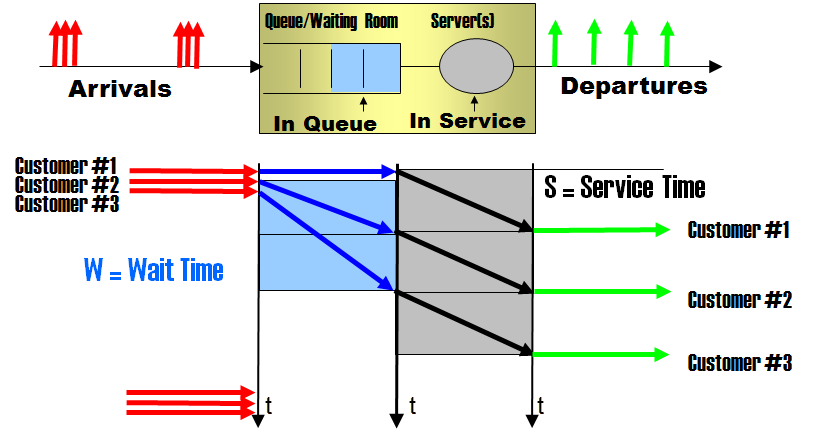
- Customer #1 arrives a t=0, spends no time at all at the queue, is given a certain service taking S units of time, and exits the center of service at t=S. The wait time is 0. The response time is S.
- Customer #2 arrives a t=0, has to wait in queue S units of time, is given a service taking S units of time, and exits at t=2S. The wait time is S. The response time is 2S.
- Customer #3 arrives a t=0, has to wait in queue 2S units of time, is given a service taking S units of time, and exits at t=3S. The wait time is 2S. The response time is 3S.
Some of the customers must wait for service and, consequently the response time has the two contributions: the service time (grey) and the wait time (blue),
Waiting for the SAPS
Looking at a SAPS benchmark report, may you tell which contribution to the response time is bigger: the wait or the service time?

Remember this first: SAPS is a performance metric measuring throughput: 1 SAPS is 1 customer service per minute, or 1 dialog step per minute (dialog step is an SAP term). The benchmark is essentially performed by progressively increasing the customer population, and monitoring the response time. When the response time reaches 1 second (R=1 s), the measured throughput, as expressed in dialog steps per minute, is the SAPS value.
A SAP server in essence is a service center for SAP dialog steps. And according to the certification report these are its measured numbers:
- There are 128 workers, corresponding to 128 HW threads executing dialog steps, so m=128.
- The average response time is measured to be 0.98 s. R=0.98 s.
- 5113000 dialog steps are executed (serviced) in an hour.
And from the above the following values can be easily derived:
- The service time is S=0.090 s , as every worker processes (5113000/128) ds per hour, and then ( 1 h / (5113000/128) ds ) · ( 3600 s/h) = 0.0901 s.
- The wait time is W= 0.89 s (W = R - S).
The dialog step response time is decomposed into 0.89 s of wait time and 0.09 s of service time:
Wow! W >> S, in fact W ~ 10·S. So it’s sure there is a queue of dialog steps waiting to be processed. If you scale this to, for example, a supermarket checkout counter that spends 5 minutes per customer, W=10·S means a 50 minutes waiting in the line!
Coming Soon
This is the first blog entry of the Demystifying the Response Time series, an exploration into the response time jungle. There are very interesting facts and analysis ahead. Stay tuned.
New blog URL: http://www.ibm.com/blogs/performance
Mirror blog: http://demystperf.blogspot.com